Swiss startup survival, part 2 of 12
Zug founds the most companies and keeps the fewest
Zug creates 2.5 times more companies per resident than Zurich, yet it had the lowest five-year survival of the five cantons in every founding year from 2013 to 2018. I tested four common explanations and rejected three.
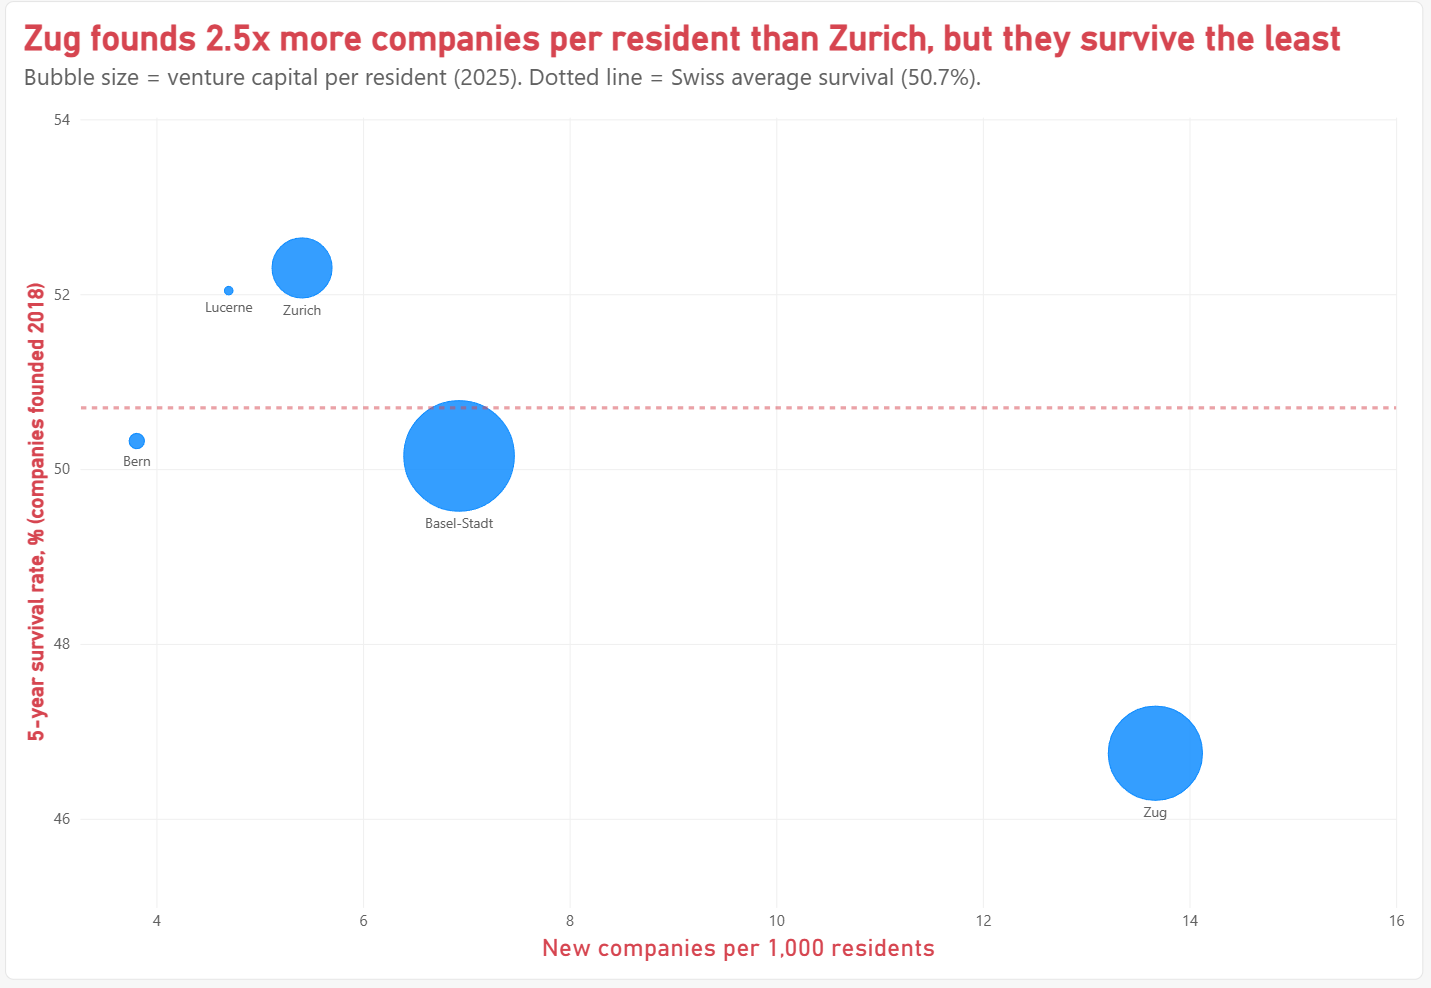
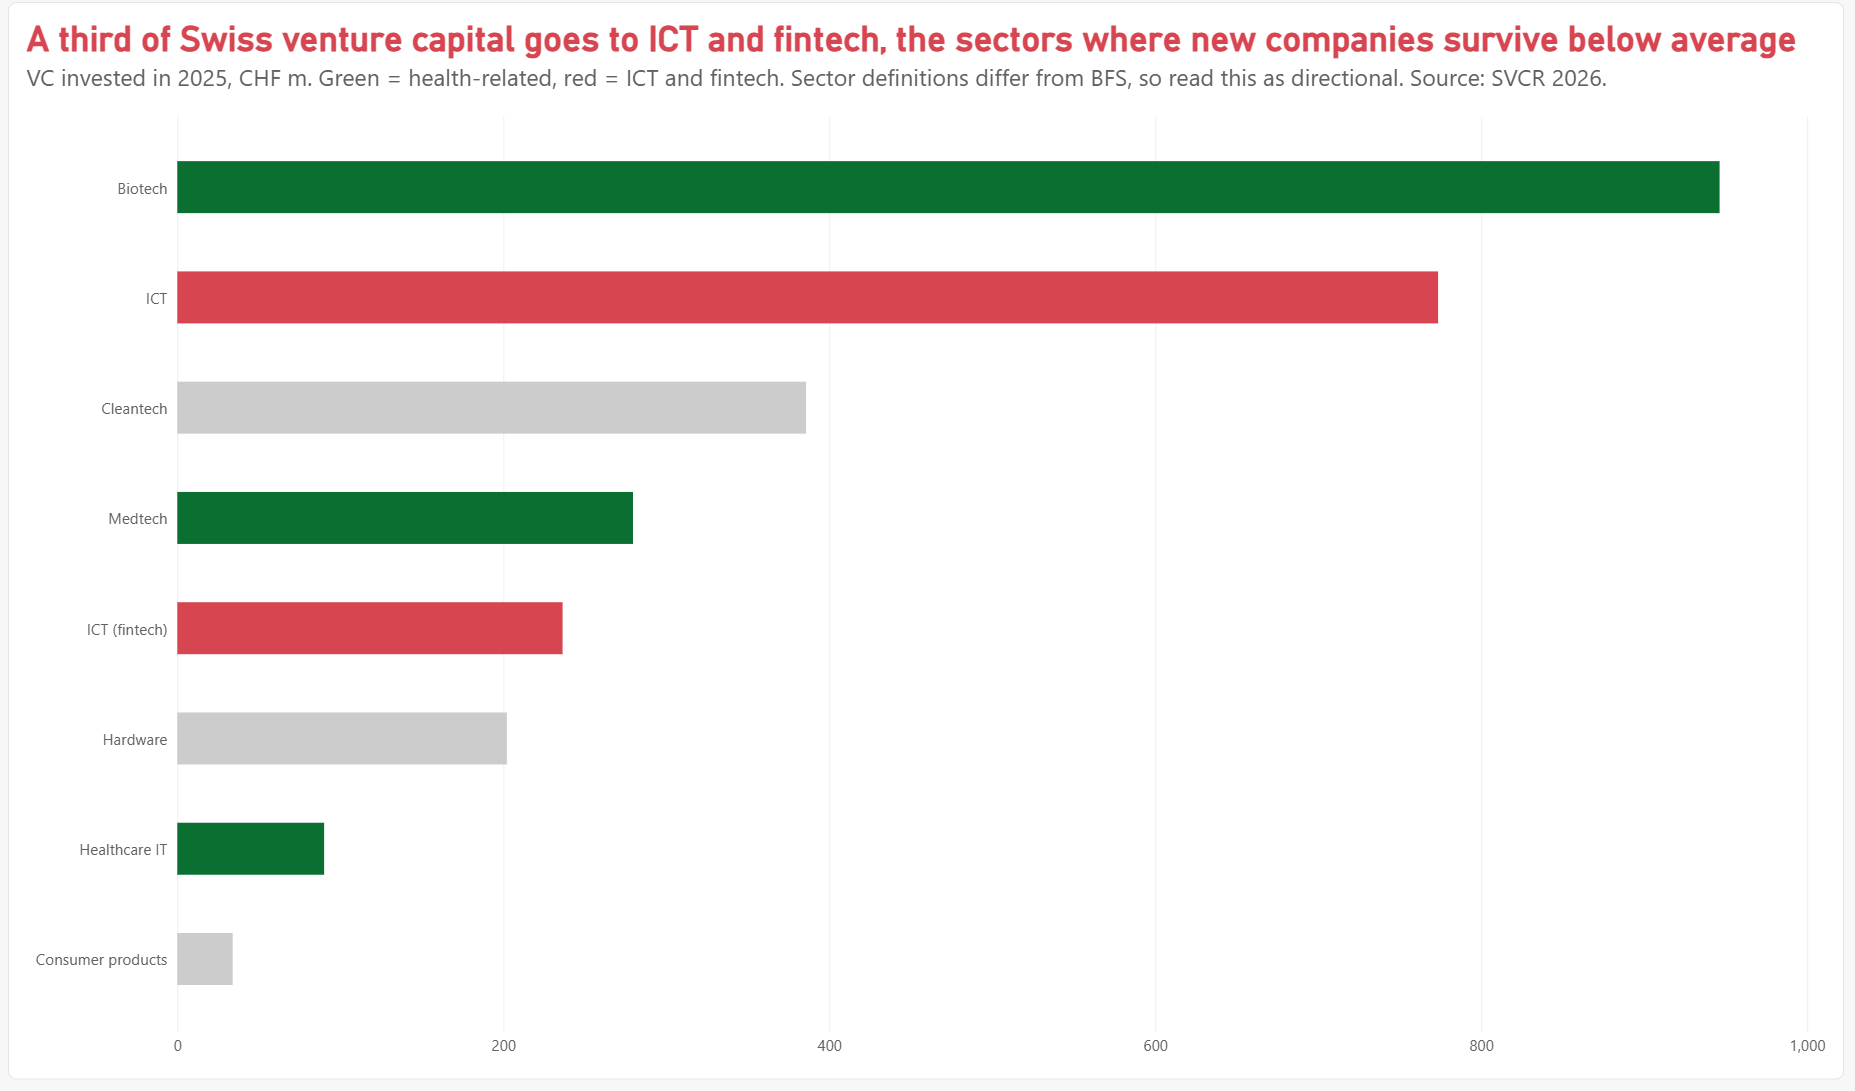
If you judged Swiss cantons by how many companies they create, Zug would win easily. It founds 13.7 new companies for every 1,000 residents, about two and a half times Zurich’s rate and more than three times Bern’s. It also attracts more venture capital per resident than Zurich.1 So I expected Zug’s companies to do well. They do not.
A pattern, not a bad year
Of the five cantons I compared, Zug had the lowest five-year survival in every founding year from 2013 to 2018.2 That consistency matters. A single weak year could be bad luck or a one-off shock; six in a row is structural. You can switch cantons on and off in the chart below to see how steady the gap is.
Zug is also a revolving door. In 2021 it had the highest rate of new companies of the five cantons, 10.3 for every 100 active companies, and at the same time the highest rate of closures, 7.5 for every 100.2 Companies arrive faster than anywhere else in my sample, and they leave faster too.
Testing the usual explanations
The easiest thing to do with a surprising number is to grab the first explanation that sounds right. Instead, I listed the explanations people usually give for Zug and checked each one against the data, the way a consultant tests hypotheses with a client.
The first is that it is all shell companies. It is not. The BFS survival statistics exclude holding companies and count only firms with real economic activity, so Zug’s low survival comes from operating businesses.2
The second is that Zug’s founders start too small. The data points the other way. Zug has the fewest one-person starts of the five cantons, 77% against 83% nationally, and one-person starts are the weakest of all. On company size alone, Zug should survive better than average.
The third is that Zug lacks money. It receives about CHF 2,026 of venture capital per resident, far more than Zurich.1
The fourth is crypto. This one is partly true. Zug is the heart of Switzerland’s Crypto Valley, and companies founded in 2018 lived through two crypto crashes. But Zug has about 715 blockchain companies in total,3 against roughly 1,800 new companies founded there every year. Crypto cannot carry the whole effect.
Before accepting an explanation, check whether it predicts what you actually see. “Shell companies” and “small starts” both sound plausible for Zug, but the data contradicts both.
What probably explains it
Two explanations fit the evidence best, and I mark them clearly as hypotheses. The first is foreign-owned companies: across Switzerland, foreign companies registered here survive only 35% of the time, the lowest of any legal form,2 and Zug’s tax regime attracts many of them. The second is mobility. A company that came for the tax rate can leave for a better one; low taxes attract precisely the companies that are easiest to move. Both point to the same conclusion: a location shapes survival mainly through the type of company it attracts.
What it means
For a canton, the lesson is uncomfortable. Measured by registrations, Zug looks outstanding; measured by companies that last and jobs that stay, it looks average at best. A better scorecard would track survival and employment three and five years after founding, not only new entries. For a founder choosing where to register, low taxes are not a survival strategy. The question is what customers, talent and network a place gives you.
Zug maximises volume, not durability. A canton that measures success by registrations will celebrate exactly the wrong number.
The obvious next step would be to split Zug’s closures by ownership. BFS does not publish survival by canton and ownership together, so it would need a custom data request, and it is on my list. The full analysis is in section 2 of the study.
-
startupticker.ch and SECA, Swiss Venture Capital Report 2026. VC per resident calculated with BFS STATPOP population figures. ↩ ↩2
-
Federal Statistical Office (BFS), Company demography: survival rates and STAT-TAB by canton. ↩ ↩2 ↩3 ↩4
-
Crypto Valley Journal, Crypto Valley Top 50 Report 2026. ↩